Over the last 5 years, the popularity of infographics in marketing has continued to climb. Thinking of creating one? Read these helpful tips
Via janlgordon, massimo facchinetti
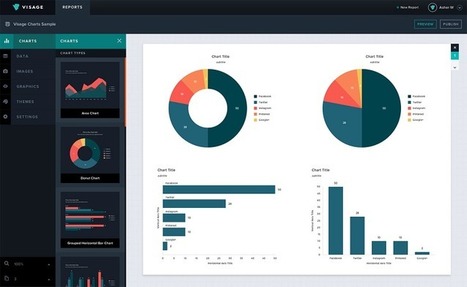
Get Started for FREE
Sign up with Facebook Sign up with X
I don't have a Facebook or a X account
digital marketing strategy
Think | Visualize strategic marketing planning Curated by malek |
Rescooped by malek from Content Creation, Curation, Management |
Over the last 5 years, the popularity of infographics in marketing has continued to climb. Thinking of creating one? Read these helpful tips
Rescooped by malek from Content Creation, Curation, Management |
Well, I’m here to tell you that it’s definitely possible to create some awesome infographics in any category that you choose, EVEN if you’re not a designer. In this blog post, I’m going to introduce you to three awesome tools to create the best infographics, tell you how to use them AND how you can share your infographics in different channels all over the web. So, let’s get started!..
Infographics makes statistics visually interesting and more palatable.
New to infographics and want to get a handle on how to make complex data speak to your clients then read on.
Rescooped by malek from visualizing social media |
Make sure your infographics don't fall flat. Learn what essential elements you need to increasing sharing.
The hard truth about creating content online is the amount of time you put into it isn't always proportional to what you get out of it. We all hope that everything we do is a grand slam resulting in traffic, leads, and reporters clamoring to talk to you.
But that's not always what happens.
Luckily, there are few things we can do to infographics to hedge our bets a bit. So, we put together the following infographic on making highly shareable infographics -- helping you rake in more views and conversion opportunities. Follow these tips, and your infographic will be much more likely to get shared.
The Essentila Elements of Infographic, piece by piece...
For more resources on Social Media & Content Curation visit http://bit.ly/1640Tbl
Rescooped by malek from Content Creation, Curation, Management |
Visage makes infographics easy, and they customize palettes for free.
If you’re an art director at a media outlet, odds are you have to assign and commission each data visualization you publish. That gets time-consuming, even when the graphic in question is nothing but a small pie chart running alongside a feature story.
Visage, a newly launched platform, provides custom templates for graphics. There are myriad tools on the market that do this (for a gander at 30 of them, check out this list), but Visage is the latest, and it's gaining traction with designers at Mashable, MSNBC, and A&E...
Rescooped by malek from Social media DAILY NEWS |
We asked Randy Krum, Founder and President of InfoNewt, an infographic
design company, and editor of the Cool Infographics website, to share some
of his insights from working with and reviewing infographics.
Don't be fooled by infographic naysayers. Yes there are BAD infographics, yet when I tracked the top 10 for my 125,000 views on Scoopit Infographics owned more than half of almost every feed's top 10. Translation - we need to create infographics and other forms of data visualization.
Here are 3 great tips from an Infographic design pro:
* Keep It Clear.
* Be Iconic.
* Know the rules.
Come to think of it those tips apply to pretty much anything we lucky few Internet marketers do :). M
If 8 tips weren't enough, here are 3 more.
Rescooped by malek from Curation Revolution |
Piktochart is an easy infographic design app that requires very little effort to produce simple and high quality graphics. Create free infographics here.
Marty (@Scenttrail) Review
I used Piktochart yesterday to create an infographic to support my 5 Easy Email Marketing Tips (http://sco.lt/7T6pTF ). I am NOT a graphic designer, but I found Piktochart helped me think like one.
Creation of my first "infographic", and I put infographic in quotes not to offend any true infographic pro, took about two hours. Piktochart's User Interface is excellent, intuitive and drag and drop friendly.
At first I tried to do everything IN Piktochart. Then I noticed they have a robust import tool so I created a draft in the tool, took a screen shot, sized the screen shot up to their 600 x 400 and worked on it in photoshop.
Piktochart, if you are reading this, you may want to make an export tool that is as easy to use as your import tool. If I could export a block at a time it would be ideal. Even when I was finished and published I manipulated some spacing of the infographic by selecting and moving blocks in Photoshop.
The tool comes complete with icons like the bulls eye and pad. I couldn't understand how to color my fonts (their styling options seem to not come up the way they are supposed too) so I added the text color in Photoshop and important the resulting block overlaying what was there.
My process made the graphic HEAVY since I had 2 copies of everything, so it would be great to export, work on a block in Photoshop, import it back in and then overlay on a blank canvas. The only way I can see to do that now is start over.
Creating visual support for our blog posts is so important Piktochart is a great new tool for any content marketer / blogger. Interesting to note my infographic of 5 Easy Email Tips got 3x the views and shares of my written Scoop. We know the visual marketing revolution is upon us, so getting as good as someone like Mark Smiciklas (http://www.intersectionconsulting.com/ ).
Piktochart is a great and timely tool! Highly recommended. Marty
A guided tour into Piktochart by a no-designer. You can't help but like the story behind the infographic.
Scooped by malek |
When someone visits your webpage, you’ve only got about 20 seconds to explain your message before he/she navigates elsewhere..
We’ve all heard the phrase, “A picture is worth 1,000 words,” and it couldn’t be truer. Visual data is absorbed 60,000x faster than text
A great visual explainimg the value of infographics
I selected this article from Curatti written by Susan Gilbert because it helps you improve your visual marketing with shareable infographics.
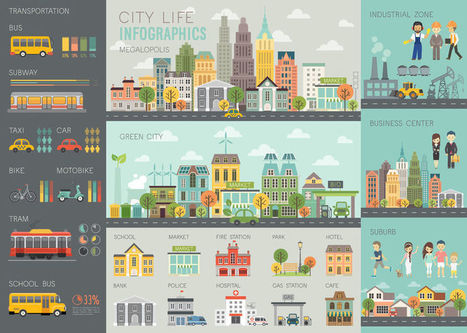
Visual graphics can be both fun and informative for your niche audience.
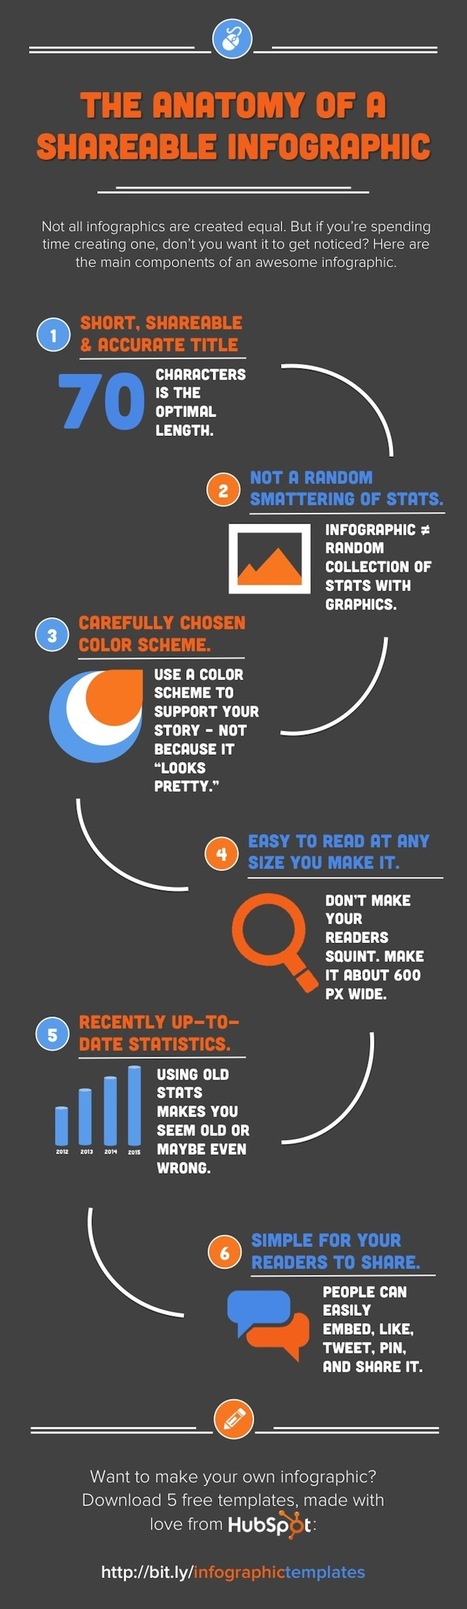
Create Infographics That Grow Your Following Online
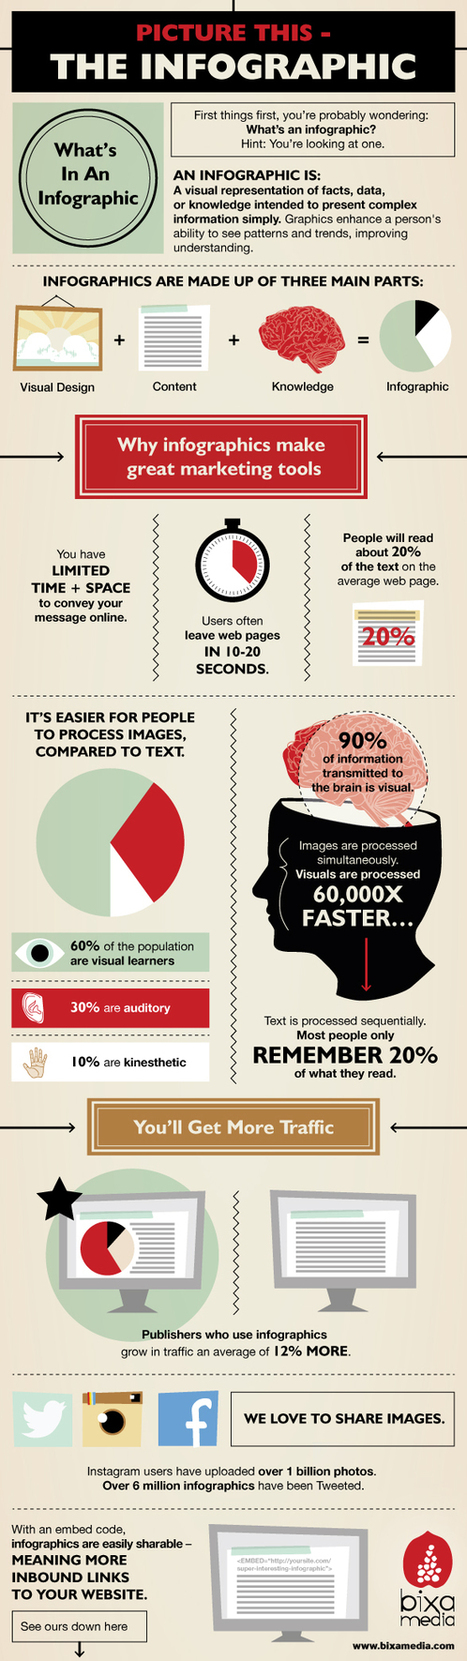
People are drawn to appealing content that grabs their attention right away. I agree that infographics can help attract more subscribers and followers.
Gilbert shows you how to create graphics that audiences are more willing to share.
Here's what caught my attention:
Selected by Jan Gordon for Curatti covering Curation, Social Business and Beyond
Featured image: 123rf.
Read full article here: http://ow.ly/x9eO30aBqyw
Stay informed on trends, insights, what's happening in the digital world become a Curatti Insider today