Public Relations & Social Marketing Insight
443.6K views | +2 today
Follow
Public Relations & Social Marketing Insight
Social marketing, PR insight & thought leadership - from The PR Coach
Curated by Jeff Domansky
Your new post is loading...
Scooped by Jeff Domansky
Scoop.it!

Scoopit Cool Content Curation Report | Atlantic BT

Scoopit Cool Content Curation Report |  Atlantic BT | Public Relations & Social Marketing Insight | Scoop.it
Why is a headline great? What content is viewed most? The Scoop.it Cool Content Curation Report answers these questions to improve your content marketing.


Scoop.it’s analytics are excellent though manual (unless I missed the export to Excel option, which is very possible). After a little over a year of Scooping content, I wanted to answer three questions:

What type of content generated the most views?

What keyword triggers formed the most successful headlines?

What is the value of cherished Internet marketing notions?


* The move to a more visual web as expressed in a sea of infographics.
* Have we reached a point of diminishing returns on infographics?
*  Is storytelling as hot as it seems?
* What about Social, Local and Mobile: Are they as hot as they seem?...

Jeff Domansky's insight:

Marty Smith's analysis will provide guidelines and spark new content marketing ideas.

ben bernard's comment, January 9, 2013 11:52 PM
thanks ! http://www.scoop.it/t/direct-marketing-services my newly made scoop.it :)
Scooped by Jeff Domansky
Scoop.it!

Why visual storytelling is the future of digital (single page view) | iMediaConnection.com

Why visual storytelling is the future of digital (single page view) | iMediaConnection.com | Public Relations & Social Marketing Insight | Scoop.it

...The digital landscape changes fast, and pictures are a main catalyst. Netscape released the first commercially available web browser in 1994, and fewer than 15 years later Flickr housed more than 6 billion photos -- that's more than 450 times the number of photos held by the Library of Congress. In 2009 more than 2.5 billion camera-enabled devices were in the hands of would-be photogs who, in the course of a year, produced 10 percent of all photos ever taken. Instagram -- the mobile photo-sharing app that Facebook bought earlier this year for $1 billion -- measures its customer engagement in uploads-per-second. Back in the quaint old days of December 2011 -- pre-acquisition and before comScore released data showing Instagram's daily usage is now greater than Twitter's -- that engagement was 60 uploads per second. By early 2012 Facebook members were uploading more than 300 million photos every single day to the site.


"This slurry of data signals the end of the Kodak Era where we took photos on birthdays and vacations and shared them only with a small group of friends," said Bob Lisbonne, CEO of Luminate and former SVP for Netscape's browser group. "We've now entered a phase in which visual communication is supplanting the written word -- what some are calling the dawn of the 'imagesphere."...


Research from a team at Harvard Business School supports Malik's claim. A 2009 study finds that 70 PERCENT OF ALL ACTIVITY INSIDE SOCIAL NETWORKS REVOLVES AROUND PHOTOS. Keep in mind that the study was conducted in a time when Facebookers were uploading a mere 31 million photos a day, and MySpace was still relevant enough to be included in a study of social-media sites....


[I highly recommend this post for marketers, content pros and PR. It provides a very strong rationale for visual content in anything to do with the Internet. ~ Jeff]

No comment yet.
Scooped by Jeff Domansky
Scoop.it!

Social Timing Insights Infographic | Argyle Social

Social Timing Insights Infographic | Argyle Social | Public Relations & Social Marketing Insight | Scoop.it
Argyle Social is on a mission to help marketers drive meaningful business outcomes through social media marketing.


[Great insight into maximizing social media engagement:

- marketers post when they're at work instead of one their audience is online

- on Facebook, marketers get better B2C engagement on weekends in the evenings

- on Twitter, marketers get better B2B engagement on weekdays during the day.


More insight on this excellent infographic ~ Jeff]

No comment yet.
Scooped by Jeff Domansky
Scoop.it!

What’s The ROI Of Posting To Pinterest? New Social Media Solution Ohtootay Tells You | TechCrunch

What’s The ROI Of Posting To Pinterest? New Social Media Solution Ohtootay Tells You | TechCrunch | Public Relations & Social Marketing Insight | Scoop.it
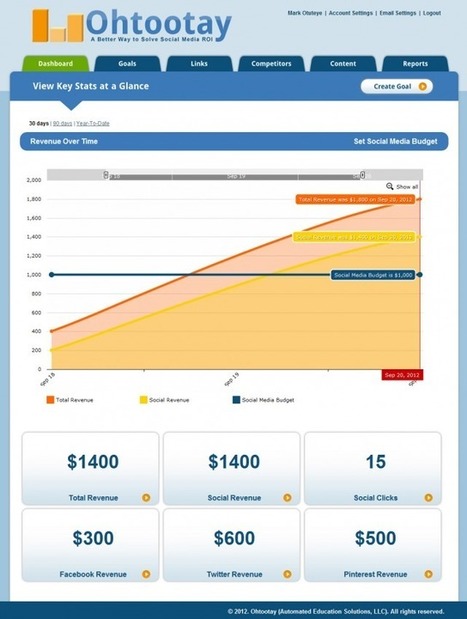
Social media managers looking to prove their ROI of what they do, today have a new option for tracking social analytics, thanks to the official public launch of a service called Ohtootay.


Crazy name aside, the solution lets companies track their efforts on Facebook, Twitter, Pinterest and elsewhere. But one of its more unique features in this crowded space is something which allows businesses to track their posts all the way through to website conversions, even when the original post didn’t point directly to their e-commerce site....


One of the platform’s standout features is its competitor comparison tool. That is, it can track what your company’s performance looks like versus competitors on Facebook, Twitter, Pinterest, and even the iPhone App Store, Android app store (Google Play) and Facebook’s App Center. “In some senses, Ohtootay is compete.com for social media and mobile apps,” Mark [Otuteye] explains. “And we believe that angels, VCs and social media managers that are armed with this kind of data will be way more effective decision makers than their peers who only navel-gaze at their own data in isolation,” he says....


[Moving beyond the last click with a promising social media measurement tool - JD]

No comment yet.
Scooped by Jeff Domansky
Scoop.it!

How Social Media Distracts You at Work [INFOGRAPHIC] | Mashable

How Social Media Distracts You at Work [INFOGRAPHIC] | Mashable | Public Relations & Social Marketing Insight | Scoop.it
This infographic details how social media interruptions impact employee productivity.


How often does the social media monster swallow you whole?

More than you may think, according to Red e App, which lets consumers get notifications from businesses without having to provide their personal information.


The company developed an infographic, below, that details how interruptions impact employee productivity.


“Is it possible to be too connected in this digital age?” Red e App asks in a blog post. “Research data indicates, yes.”...


[WHOA! BIG numbers! Now, you better get back to work - JD]

No comment yet.
Scooped by Jeff Domansky
Scoop.it!

When Is The Best Time To Post To Twitter, Facebook, Pinterest And Google+? | AllTwitter

When Is The Best Time To Post To Twitter, Facebook, Pinterest And Google+? | AllTwitter | Public Relations & Social Marketing Insight | Scoop.it

...So, when is the best time to post? And is it the same for every social network?


RadiumOne’s Po.st examined the social sharing data from more than 10,000 publishers, reaching four main conclusions:

1. There are two peak sharing times during the day – 10 a.m. through noon and 8 p.m. through 10 p.m.
2. If you’re looking for clicks, the worst time to share an article is between 9 a.m. and 11 a.m.
3. Sharing and clickbacks remain consistent from 1 p.m. to 6 p.m.
4. The hours between noon and 2 p.m. see the most shares with the highest clickback rates.


The study also revealed a disconnect between the best times to post to each social network, which are as follows:

Twitter: 1 p.m.
Facebook: 5 p.m.
Pinterest: 11 p.m.
Google+: 10 a.m.


[Here's an interesting research update to the best times to post on various social channels ~ Jeff]

No comment yet.
Scooped by Jeff Domansky
Scoop.it!

Sex? No thanks, baby, I'm hitting Facebook instead | LA Times

Sex? No thanks, baby, I'm hitting Facebook instead | LA Times | Public Relations & Social Marketing Insight | Scoop.it
Turns out that when you think of Facebook, you may be feeling a hunka-hunka burning love.


Cue the Barry White makeout music.


Researchers at the University of Chicago Booth School of Business say the desire to indulge in Facebook, Twitter and other social-media pastimes is among the strongest temptations we now face -- right up there with sex and cigarettes....


[Research in the search of the obvious but still interesting LOL ~ Jeff]

No comment yet.
Scooped by Jeff Domansky
Scoop.it!

Metrics Are Easy; Insight Is Hard

Metrics Are Easy; Insight Is Hard | Public Relations & Social Marketing Insight | Scoop.it
A four-step process for generating useful knowledge from social data.


Big data is great. But we should consider that we've actually had more data than we can reasonably use for a while now. Just on the marketing front, it isn't uncommon to see reports overflowing with data and benchmarks drawn from millions of underlying data points covering existing channels like display, email, website, search, and shopper/loyalty — and new data streams such as social and mobile engagement, reviews, comments, ratings, location check-ins and more.


In contrast to this abundant data, insights are relatively rare. Insights here are defined as actionable, data-driven findings that create business value. They are entirely different beasts from raw data. Delivering them requires different people, technology, and skills — specifically including deep domain knowledge. And they're hard to build.


...Here's a four-step marketing data-centered process that doesn't stop at the data, but focuses instead on generating insights relevant to specific segments or affinity groups...


[Good suggestions for social media measurement from the Harvard Business Review - JD]

No comment yet.
Scooped by Jeff Domansky
Scoop.it!

50% of Consumers Value a Brand's Facebook Page More Than Its Website [INFOGRAPHIC]

50% of Consumers Value a Brand's Facebook Page More Than Its Website [INFOGRAPHIC] | Public Relations & Social Marketing Insight | Scoop.it
If you're debating the power of social media for branding, here's more proof that it matters.


About 50% percent of consumers think a brand’s Facebook page is more useful than a brand’s website, a new study suggests.


Market research company Lab42 — which surveyed 1,000 social media users about how they interact with brands on Facebook — found that consumers are viewing a brand’s Facebook presence as more important than ever.


In fact, about 82% of respondents said Facebook page is a good place to interact with brands. But one of the top reasons to follow a brand on Facebook is to print coupons and discounts. The study revealed that 77% of those who “Like” a brand on Facebook have saved money as a result.


Consumers (73%) also noted that they have no issue with un-Liking a brand on the site if they post too often.


For a full look at how a brand’s Facebook presence is viewed and valued, check out the infographic from Lab42 below....

No comment yet.
Rescooped by Jeff Domansky from Everything Pinterest
Scoop.it!

Comparison: Tumblr vs Pinterest vs MySpace in terms of unique visitors

Comparison: Tumblr vs Pinterest vs MySpace in terms of unique visitors | Public Relations & Social Marketing Insight | Scoop.it

...Tumblr collected 6.7 million mobile visitors and 24 million search visits in July.


Tumblr currently hosts 74 million blogs and 31 billion posts. It collects about 100,000 new blogs every day.


The top social networking sites in the world in terms of visits are Facebook (7 billion), Twitter (182 million), Pinterest (104 million) and LinkedIn (86 million), according to Experian Hitwise.


Via Allison Tyler
No comment yet.