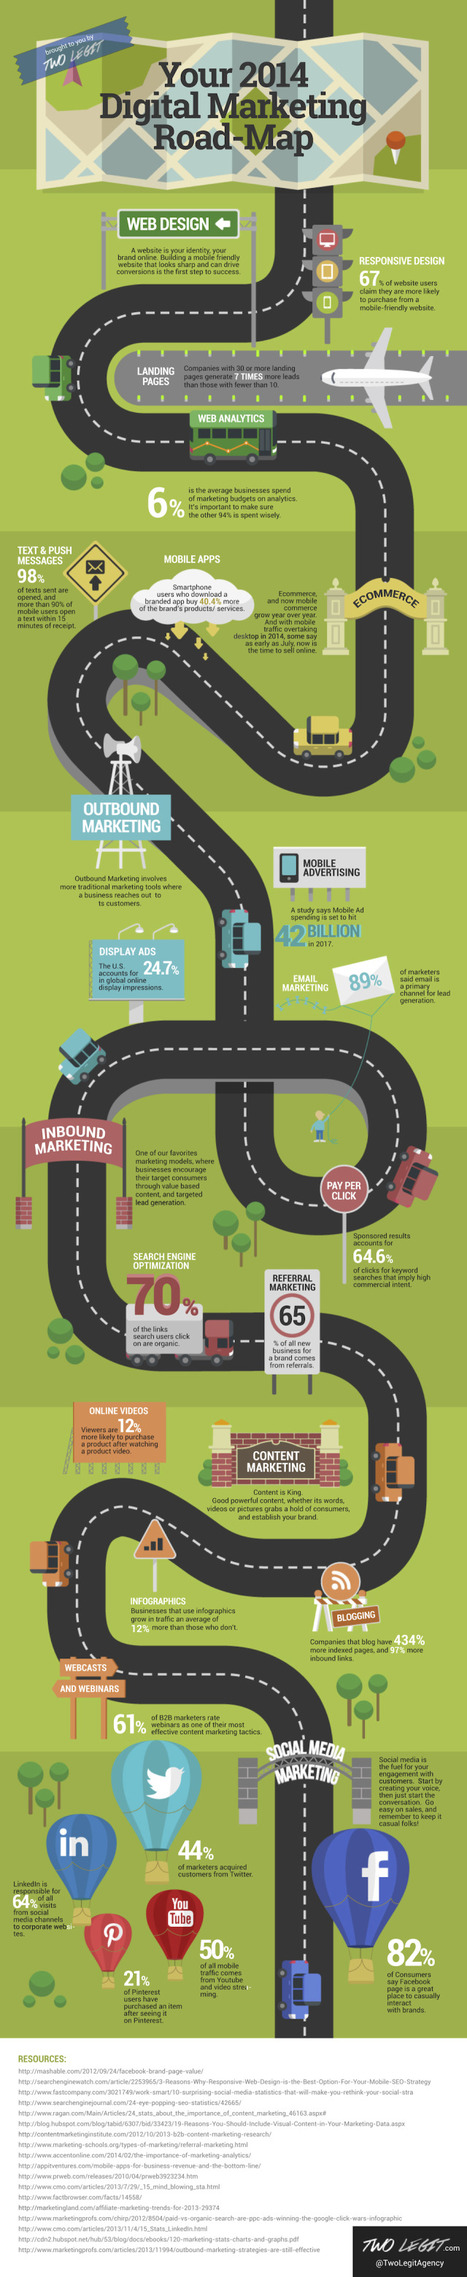
Sometimes it’s easier to just follow the dotted line as you’re looking to ensure your digital marketing is balanced and complete. This infographic compliments of Two Legit aims to do just that, walking you through your web presence, mobile, ecommerce, outbound, inbound, content and social media marketing initiatives.+
One element lost in this infographic is the ability for all of the strategies to work with one another. For instance, utilizing your content marketing to power newsletters that are optimized for mobile devices. That’s not defined in this infographic but it’s an absolute necessity if you’d like to fully leverage email and ensure your emails are read properly. I’ve written before that the modern digital media consultant is more of a conductor, balancing the volumes of each strategy to make some sweet, sweet music!+
More often than not, we find that the key to marketing well isn’t doing everything… it’s balancing a combination of strategies, amplifying the impact by having them work together, and understanding how much of each strategy to initiate in order to maximize results. That said – this is still a great checklist to go down and ensure you’re not missing anything! This infographic also provides some statistics behind the digital marketing trends.


 Your new post is loading...


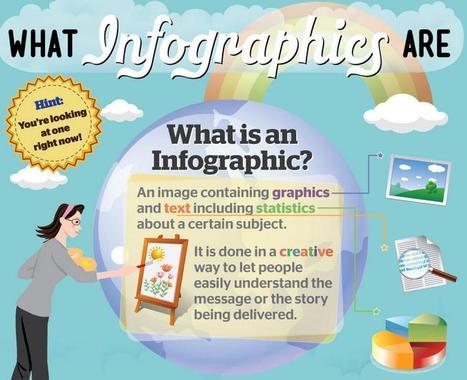


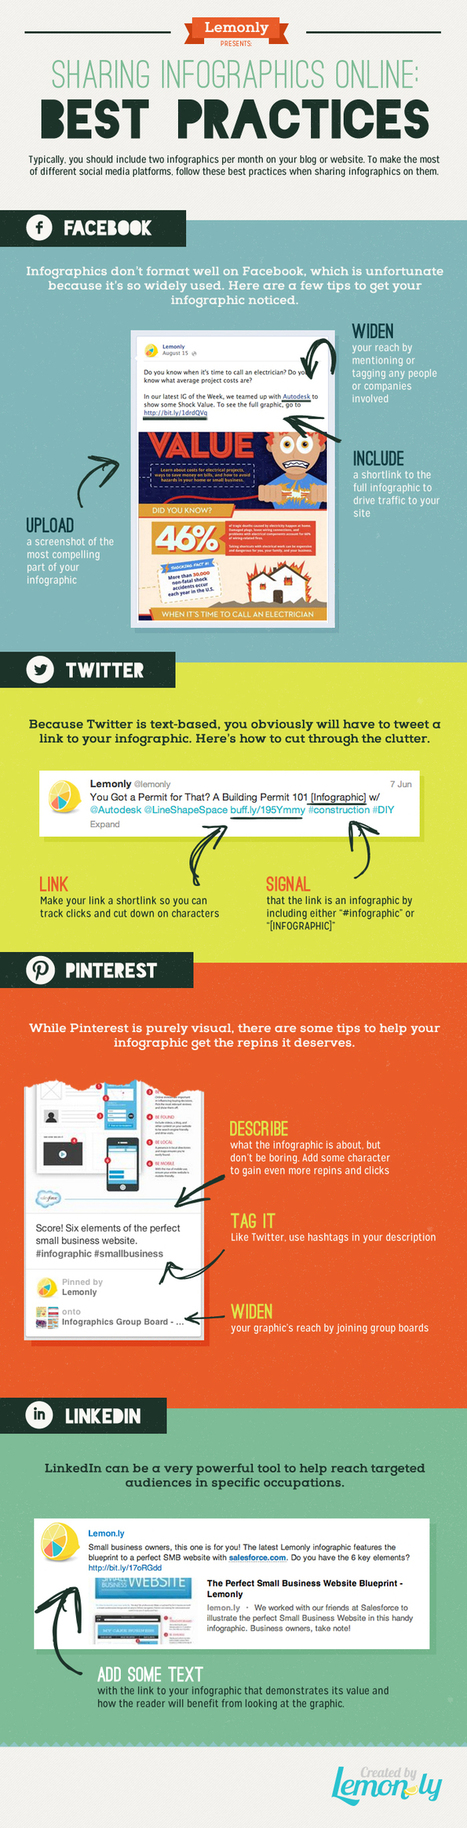


Infographics are fun (and easy!) to design if you have the right tools.
Les infographies sont très bien. Ici au moins on est réaliste sur le temps de la création.
Someday I will learn to make infographics. Here is the place to start.