 Your new post is loading...
Infographics, an effective form of content marketing, are everywhere on the Web, but it isn't always easy to come up with good designs when you want to create one yourself, especially if you're not skilled in design and visual content. Fortunately, you have plenty of options. Many blogs and other publications offer tips and tricks to help improve your visual content, and sites like online infographic maker Visme (which I founded) and applications such as PowerPoint offer templates to help you get started. Templates help you get a general feel about what works for an infographic and what doesn't, which can then allow you to branch out with your own designs. Often, though, in the business world, a lot of templates are simply tweaked to create an infographic; the basic template remains intact. After all, if it isn't broke, why fix it? So here are five of the most popular templates, the reasons they work so well, and a few tips and tricks to help you make them your own....
As a marketer, your content strategy is very important. Blogs, articles, social media posts, slide presentations, etc. There are so many ways to market your content. But in the last few years, infographics have caught the attention of online marketers and media professionals. They feature a combination of text, design, and images to convert complex data into an easy-to-read piece of content.With evolving visual communication, infographics are now focusing on driving flexibility, shareability, and audience engagement. The three trends that will help you in doing so are...
Infographics can also be a helpful device to generate more leads. Generally, the same rules apply here as for creating any effective visual content -- it serves as a conversion path as a result of shareability and informative nature. But what are the specifics there? What are the different ways to create the infographics that are going to generate leads? We identified five of our favorite ways to go about doing that, and outlined them below....
A new report from a company called Clutch suggests the pulse of infographics -- at the heart of many content marketing strategies -- is weakening.
But to borrow a phrase from Mark Twain, are reports of the death of infographics greatly exaggerated?
In a Clutch news release about its report, Rand Fishkin, founder of SEO software company Moz, practically delivers a eulogy for infographics.
“The age of infographics is dying, and most of them are quite bad,” Fishkin is quoted as saying. “The ones that have success do so in a slightly manipulative way. The embed gets linked back with very particular anchor texts that take advantage of search algorithms.”
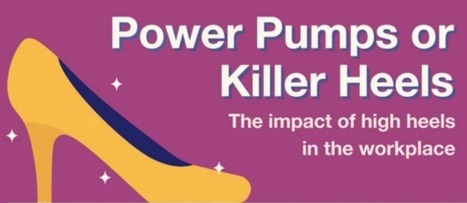
I work in an office where I can get away with wearing flip-flops most days, but many women aren’t so lucky.
Women are often expected to wear high heels, and some companies even require it in their formal dress codes.
Of course, there’s nothing wrong with wearing heels. Sometimes it’s fun to feel taller and a bit more powerful. But this infographic shares the not-so-great reason women are still expected to wear stilettos. High heels have been viewed as feminine and sexually alluring over the years and are thought to command attention.
Earlier this year, an employee at PwC challenged her company’s dress code for requiring heels. The company changed its policy after public outcry and now allows flat shoes.
If you wear high heels too often, you may end up with back pain and weaker ankles. Employers can require employees to groom themselves, but there can’t be discrimination against one employee. Rules have to apply to every employee....
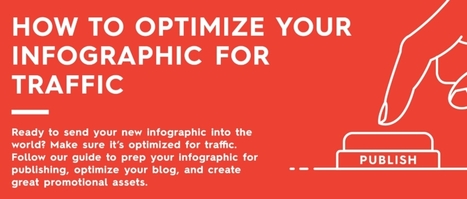
Just because you have an infographic designed does not mean it’s ready to go. There are a few more steps necessary to ensure success. You need to proofread. You need to publish. And, of course, you need to promote. Basically, you need to know how to optimize your infographic to get the most traffic. Unfortunately, we see many brands make rookie mistakes in all three of these areas. Whether it’s an unoptimized file name, broken share buttons, or pixelated images, these details can seriously hurt your infographic’s success. If you want to get the most eyes on your infographic, there’s more to do than you think. But don’t worry. Because our parent company Column Five likes to make things easier for you, they created this handy checklist to help you optimize your next infographic. They even put it in infographic form and checklist form. Feel free to print them out, bookmark them, or embed them on your site. Follow their tips and you’ll know your infographic is really ready to be published. On that note, you can also take a look at these deep dives into how to optimize your infographic for SEO and how to optimize your blogfor content distribution. Good luck out there!...
If you ask us, infographics aren't going anywhere.
This year alone, we've covered how essential they are to SEO, and the numerous resources available to create beautiful infographics of your own.
And yes -- when it comes to infographics, we do like to play favorites. That's why we went scoured the web for some of the best infographics of 2016. Their topics are vast and their formats are many, but this year, we truly saw some excellent examples of informative design....
If you have a ton of data and you want to tell a good story, interactive infographics are a fantastic tool. They entice your audience to explore the content, whether it’s a data set or a guided storytelling experience, and they can provide far more information than a static infographic. So, what makes a good interactive infographic? Whether it’s super simple or incredibly complex, it comes down to good design, engaging interactivity, and an interesting subject. The options are pretty much endless. If you’re thinking about experimenting with interactive infographics or looking for some serious inspiration for your next project, we’ve rounded up our favorites. Scroll through the whole list (they’re listed, not ranked), and click on the images to visit the interactive infographic....
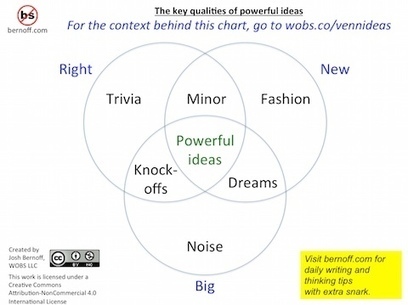
A good infographic is a graphical story. It basically says “Here is a quick way to understand something important.” If it is a story about something that people care about, it will spread. Here’s what happens in the reader’s mind when they see an infographic worth spreading: “What’s this? Oh, it’s about [topic I care about]. Wow, this is everything I agree with in one place. It explains it so simply. I’m going to print this out/post this on Facebook/email it to the whole department, because maybe then people will understand.” Unless you can imagine a lot of readers saying something like this, you’ve probably got the wrong topic for an infographic....
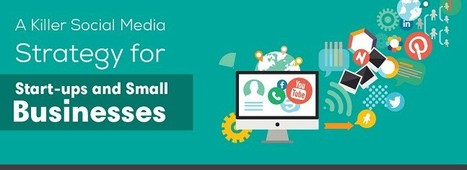
Marketing on social media can be a daunting task for a small business or a startup. With so much conflicting advice and competition, it can seem impossible to even get started. An infographic from Social Media Marketo outlines 12 crucial steps your business can take to set up for success. More than 90 percent of marketers indicated that they use social for marketing and that social media marketing is important for their business. Sales teams said using social helps them reach their sales goals, consumers use social to research products and more than 30 percent of all web traffic is driven by the top eight social sites. Indeed, social is an important part of doing business on the Internet....
Via malek
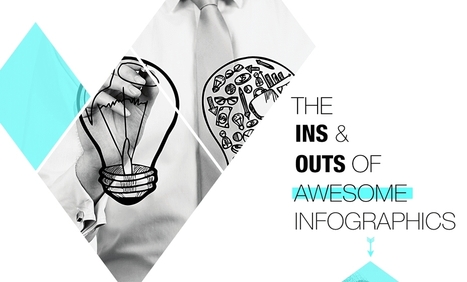
Infographics take complex data and information and translate it into easy-to-understand visuals. In today’s fast-paced world, graphic designers need to get the point across simply and efficiently. In this article, we’ll take a look at several infographics and their inherent qualities, then offers a brief tutorial to help you create your own!...
Infographics are used heavily in just about every niche now, and vary from deadly boring to downright amazing.
But what makes the difference between the two?
It all boils down to this: infographics go viral because they catch the attention of the audience they are intended for. If the person or organization creating the infographic doesn’t know their audience and doesn’t know what that audience wants or needs, the infographic is going to be dead in the water. Before you ever sit down to create an infographic, take a good long look at hat
Before you ever sit down to create an infographic, take a good long look at who you’re creating it for and why....
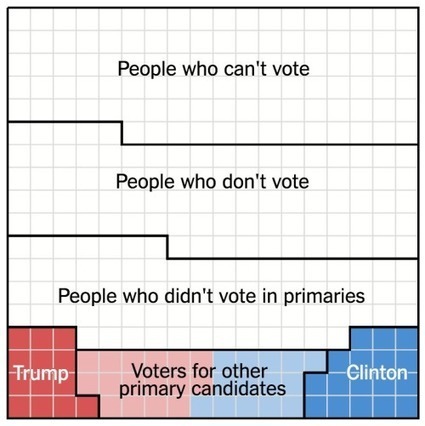
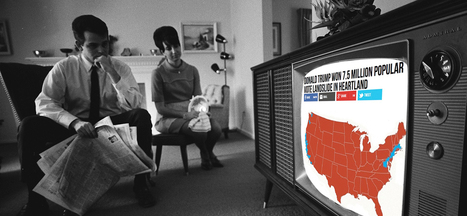
Designed by Alicia Parlapiano and Adam Pearce for the New York Times, this short series of data visualizations tell a very clear story about how Only 9% of America Chose Trump and Clinton as the Nominees For the 2016 Presidential election. The United States is home to 324 million people. Each square here represents 1 million people.103 million of them are children, noncitizens or ineligible felons, and they do not have the right to vote. 88 million eligible adults do not vote at all, even in general elections. An additional 73 million did not vote in the primaries this year, but will most likely vote in the general election. The remaining 60 million people voted in the primaries: about 30 million each for Republicans and Democrats. But half of the primary voters chose other candidates. Just 14 percent of eligible adults — 9 percent of the whole nation — voted for either Mr. Trump or Mrs. Clinton....
|
Your brain can identify and retain details of an image in 13 milliseconds. That’s less than a 20th of the time it takes to blink your eyes. So it’s no surprise that visual content is on the rise as attention spans shrink. If you could choose between a consumer spending 20 seconds with a wall of text or 20 seconds with an image, it makes sense to go with the latter. In other words, people like looking at stuff. As such, infographics are rapidly becoming an essential component of a solid content marketing strategy. Free tools like Canva and Pixlr make it easier than ever to turn your data into compelling visual content. The best infographics give equal weight to both parts of the word – they combine essential info with stellar graphic design. I could write a whole blog post about how great infographics can be. But, of course, that would defeat the purpose. Instead, let’s look at ten great infographics with a meta twist: They’re content marketing assets about content marketing! These examples can inspire your own infographic creation while they inform your strategy....
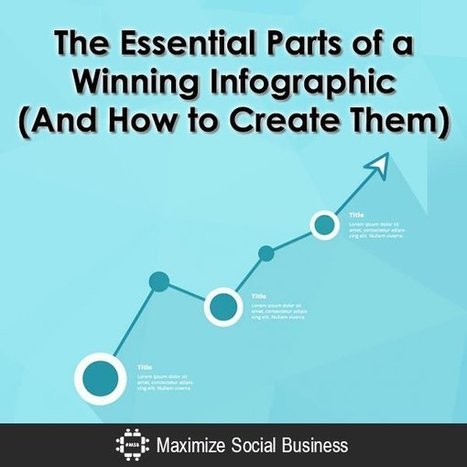
Incorporating the use of infographics into your content marketing is a great way to boost social media engagement, conversions, and your brand’s credibility as an information source. However, it’s not a “magic bullet” that can be implemented with no strategy whatsoever.
Remember that customers, influencers, and competitors will judge your brand quality by the kind of visual content you publish. Apart from understanding the different types of infographics, you also need to know the essential parts that make an infographic shareworthy. You also need to execute a well-planned promotion strategy to fully leverage the infographic.
Of course, hiring an infographic design specialist and a content marketing expert for promotion purposes is one way to go. But if you have a DIY-style infographic strategy here are the components you shouldn’t forget:
Infographics can be powerful content marketing tools. The format can help brands easily explain complicated subjects, processes, or data-driven insights. Research has found that people who follow directions with text and illustrations do so 323% better than those using just text. And nearly 50% of the brain is focused on visual processing. Plus, social media networks prioritize visual content – and strong visuals catch peoples’ eyes. Tweets with images get 313% more engagement. At NewsCred, we’ve found infographics to be valuable top-of-funnel content....
For the most part, fake news stories are still relatively crude and unsophisticated, with nothing more than text, a photo grabbed off the internet, and hyper-partisan, attention-grabbing headlines to lure clicks and shares. But fake news creators might begin to include one thing that journalists and researchers already know works to increase engagement: data visualizations. Readers Believe Data Visualizations The mere inclusion of a simple data visualization, like a chart or map, has shown to significantly increase a story’s believability, whether true or not. Researchers from Cornell University tested readers with two articles on a scientific claim, both identical except in one regard. One included a graph and the other did not. While only 68 percent of readers believed the claim in the article without a graph, nearly all –97 percent– of readers believed the same claim with the graph included. Similar effects were seen when a chemical formula was included, suggesting that the persuasive effects are based on the association of a graph with what the researchers call the “prestige of science.” The researchers conclude that “graphs signal a scientific basis for claims, which grants them greater credibility.” While their conclusions pertain to science stories in particular, it’s just one step to the applicability to news in general to infuse them with an aura of scientific backing....
What makes people want to share an infographic?
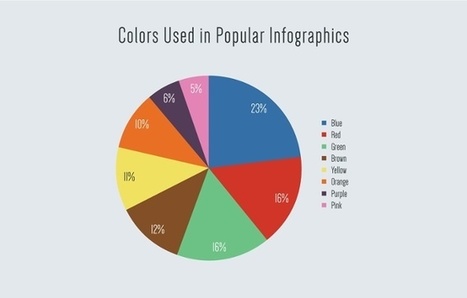
Is it a certain color scheme that catches the eye? Do certain formats work better than others? Or, in the end, is it all about the content? At Visme, we set out to answer these questions by performing a content analysis of the most shared infographics on social media.
Using BuzzSumo, we identified every infographic with more than 5,000 shares across some major social media platforms -- Facebook, Pinterest, Twitter, LinkedIn, and Google+ -- and analyzed them for different characteristics. Those were things like word count, size, colors used, format, and topic.
Here's what we found after analyzing over 200 infographics -- and takeaways on how you can apply these insights to your own infographics, making them more shareable....
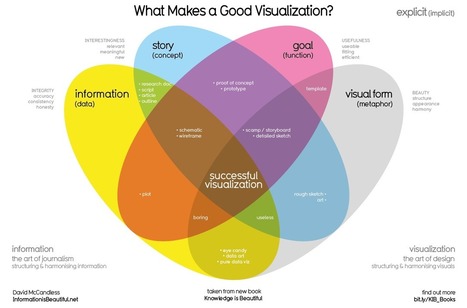
We are hardwired to be visual. Science has proven vision is the most powerful of all our sensory systems for cognition. 90% of all input in our brains is visual. People remember 60% of what they see, but only 40% of what they read. What’s different nowadays is the shift from functional charts and graphs to more beautiful, interactive infographics. Boring designs increasingly fail to engage our audience; people crave for more art-like visuals. For the vast majority of non-designers out there, the challenge is to strive for a balance between beauty and functionality. In our quest to learn how to make sense of all the information out there, we asked 25 experts for their best advice on how to tell visually compelling data-driven stories. We hope these experts’ tips will help you communicate data-driven information in an engaging way....
This interactive infographic by Ceros visualizes a study conducted by GumGum and Brand Innovators about the power of visual content.
Sure, articles let brands talk directly to customers about solving problems, like how to save for a home while paying off student loans, for example. Blog posts have relatively low overhead compared to, say, a national ad campaign or video product release, and in some industries such as finance, they are necessary to edge out competitors trying to capture the same audience. But a content plan with only blog posts is like a diet that consists solely of bananas. Sure they provide some value and it’s safe to eat one per day, but without diversity you’re going to become malnourished. The problem for many brands is they don’t have the data to justify alternative approaches that may cost more than a 600-word article. When our data scientists examined 3,200 stories produced on the Contently platform over the last year, they found that a different type of content outperforms blog posts across most industries: - Infographics reach 54 percent more readers than blog posts. - The median cost to reach one reader for an infographic was $0.04 versus $1.77 for a blog post. -Infographics have a 73 percent completion rate. Blog posts have a 66 percent completion rate....
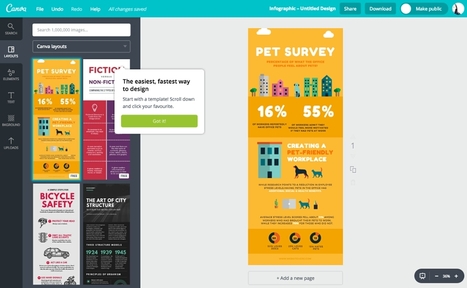
Visuals have a huge impact in marketing. Not only do they make content more sharable -- 40 times as much -- but they help us retain information. When details are paired with an image, we remember 55% more of it. That can be pulled off with infographics -- the nifty images that visually break down complex statistics. They're customizable, sharable, and they're easier to create than you might think. Sure, you could hire a professional to create the infographics for you. But if you're restricted by budgets or time, there are some great DIY resources out there for making compelling visuals. We scouted the web for some of them -- check them out below. (And for more on how to create an infographic, check out these tips.)...
By combining great visuals, great data, and great copy, they stimulate powerful learning centers in the brain, helping connect ideas much quicker than images or text alone. So, how do you put them to work for you? Whether you’re a newb who’s never worked on one before or an OG who’s done it a million times, remember that all good infographics start with good infographic ideas. I’ve sat through a couple thousand infographic brainstorms, and I know firsthand that coming up with a killer idea doesn’t always happen at will. So, to make things easier—and share some hard-earned knowledge—I’ve compiled a list of some of the more tried-and-true ways to come up with great infographic ideas, as well as a few examples to inspire you. I hope it helps your next brainstorm....
Via Ana Cristina Pratas
Real Money has done the math and shared their findings in the infographic Examining the Real Cost of Donald Trump's Wall, designed by DesignBySoap. It appears that the actual cost of the wall would end up being 2-3 times more expensive than the publicly released estimate. Luckily, even many of his supporters do not believe he will build the wall. You can see the details of Trump's plan, as well as some statistics on how Americans feel about it in the infographic above.
These tasty mouthfuls will stretch your idea of what can get go between two (or maybe three) buns. Would you like pickled lemon with that?
I would try all of these, and I bet some are shockingly good. People seem to like putting the french fries into the burger, which, since I like putting potato chips in my sandwiches, I have no right to hate on. It sounds pretty good actually.
I can’t decide if the Mos Rice burger or the Vada Pav is the biggest departure from a traditional burger. On one hand, at least the Vada Pav uses bread for the buns and has something fried in it. On the other hand, at least the Mos Rice has some layers of stuff in it instead of one ball of fried whatever. Actually, a ball of fried whatever is very in line with burger tradition, so I’m going to say that the Mos Rice is the least burger-like burger on this list....
|


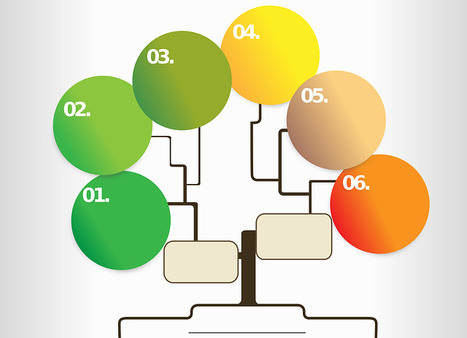


MarketingProfs shares 5 types of infographic templates that work well, with tips to help you create your own infographics.