


 Your new post is loading...


I just created a new Twitter account, and it got me to thinking about all the data visualization I've seen for Twitter tweets. I felt like I'd seen a lot, and it turns out there are quite a few. Here they are grouped into four categories - network diagrams, maps, analytics, and abstract.
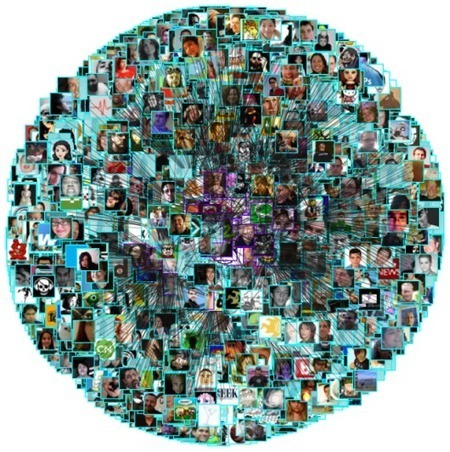
Twitter is a social network with friends (and strangers) linking up with each other and sharing tweets aplenty. These network diagrams attempt to show the relationships that exist among users....


Several very creative visuals. Have a look!