


 Your new post is loading...


Our industry faces a well-known duopoly, with Facebook and Google commanding an ever-increasing share of digital ad spend, both in the U.S. and globally. I recently dug into the data and forecasts available, to better quantify (for my own benefit and hopefully yours!) just how much Facebook and Google are eating digital.
Global ad spend, across all channels (digital, TV, print, radio, outdoor, etc.) is growing annually on average by 5.6 percent from 2015 to 2020, and will reach $674 Billion from $513 Billion in 2015.
The U.S. market will represent 35 percent of the global ad market, reaching $234 Billion by 2020 with a slightly slower growth rate compared to the global average, at 5.0 percent from 2015 to 2020. This is expected as rapidly developing markets in the East and a growing middle class represent new markets on which advertisers can focus.
45% Of U.S. Ad Spend Will Be Digital
33 percent of ad spend in the U.S. was digital last year and that is expected to reach 45 percent by 2020. In real numbers, that’s a $60-billion market growing to $105-billion, with a Compounded Annual Growth Rate (CAGR) of 11.9 percent.
The growth of digital is more than 2 times higher than the growth of the overall ad market, which represents a tremendous opportunity for digital businesses. More people are accessing content online and more advertisers are spending their budgets online. Will the rising tide lift all ships?...


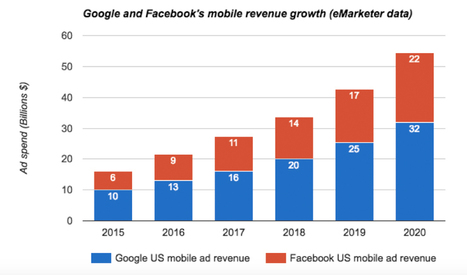
Facebook and Google dominate digital ad revenue and here's a look at how the industry shapes up globally.