Public Relations & Social Marketing Insight
443.6K views | +0 today
Follow
Public Relations & Social Marketing Insight
Social marketing, PR insight & thought leadership - from The PR Coach
Curated by Jeff Domansky
Your new post is loading...
Scooped by Jeff Domansky
Scoop.it!

Infographics Lie. Here's How to Spot the BS

Infographics Lie. Here's How to Spot the BS | Public Relations & Social Marketing Insight | Scoop.it

We live in an age of Big: Big Computers, Big Data, and Big Lies.


Faced with an unprecedented torrent of information, data scientists have turned to the visual arts to make sense of big data. The result of this unlikely marriage—often called "data visualizations" or "infographics"—has repeatedly provided us with new and insightful perspectives on the world around us.


However, time and time again we have seen that data visualizations can easily be manipulated to lie. By misrepresenting, altering, or faking the data they visualize, data scientists can twist public opinion to their benefit and even profit at our expense.


We have a natural tendency to trust images more than text. As a result, we’re easily fooled by data visualizations. But fortunately, there are three easy steps we can follow to save ourselves from getting duped in the data deluge....

Jeff Domansky's insight:

Do visuals lie more easily? Infographics are all over the place nowadays. How do you know which ones to trust? Follow these three easy steps to save yourself from getting duped.

Jeff Domansky's curator insight, January 3, 2015 1:25 AM

Do infographics lie more than other types of news? It's an intriguing question.

Marco Favero's curator insight, January 3, 2015 6:49 AM

aggiungi la tua intuizione ...

Scooped by Jeff Domansky
Scoop.it!

Rated I: For Strong Infographic Content | Marketo

Rated I: For Strong Infographic Content | Marketo | Public Relations & Social Marketing Insight | Scoop.it

At Marketo we have a pretty interesting and diverse set of infographics – covering topics from marketing automation and social networks, to kittens and bacon. But those are just examples of how versatile infographics can be as a content medium. So why aren’t all marketers leveraging the blockbuster power of infographics?


Infographics for everyone!


Unless your target market hates visual content (we’re not judging!) then infographics are probably something you can add to your content repertoire. They are an awesome way to clearly present complex information. For example, if you have an interesting but dense report that you’d like more people to engage with, try translating that information into an infographic. People absorb visual content faster and with greater ease than reading the same information....

Jeff Domansky's insight:

Get the picture? Visuals work and infographics are still a valuable social marketing tool.

No comment yet.
Scooped by Jeff Domansky
Scoop.it!

Five Elements of Inbound Marketing | ChooseWhat

Five Elements of Inbound Marketing | ChooseWhat | Public Relations & Social Marketing Insight | Scoop.it

Recently we came across this great infographic by AXZM detailing the five elements of inbound marketing for your business. While they seemed to have channeled Captain Planet to design and categorize this infographic; using Earth, Fire, Air, Water, and the fifth element “Aether” that binds all other forces together.


It’s a great guide for a marketer or business owner just starting out in marketing. Each element is tied to an inbound marketing tactic and is partnered with a brief description of the benefit of each tactic, popular platforms, tools used and/ or best practices to implement.

What is Inbound Marketing?

Inbound marketing is a relatively new marketing concept where marketers aim at getting discovered by potential customers who are actively looking for your product or solution. This idea of “being where your customers are looking” contrasts the traditional way of marketing through television commercials, cold calling, direct mail, trade shows, etc....

Jeff Domansky's insight:

Helpful look at inbound marketing from definition to tactics. All tied together nicely in an infographic. 

No comment yet.
Scooped by Jeff Domansky
Scoop.it!

5 Websites an Infographic Researcher Can’t Live Without | Neo Mamm

5 Websites an Infographic Researcher Can’t Live Without | Neo Mamm | Public Relations & Social Marketing Insight | Scoop.it

Researching may sound easy: with a quick Google search, almost anything can be found. But the internet also holds some gems for when you want to get that social or trend based angle.


Here are the top five websites that make my job easier. They can also be interesting to play about with too!...

Jeff Domansky's insight:

Five useful tools for content marketers and infographics makers.

No comment yet.
Scooped by Jeff Domansky
Scoop.it!

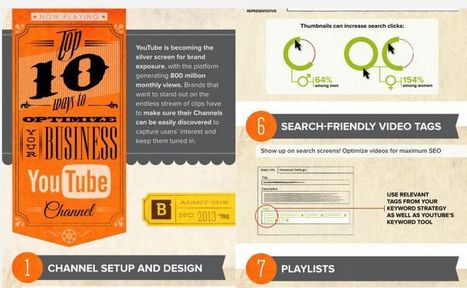
10 interesting infographics about social media | Design daily news

10 interesting infographics about social media | Design daily news | Public Relations & Social Marketing Insight | Scoop.it
We all know a picture speaks thousand words and for that reason infographics are being more popular due to its amazing information displayed in the form of images. It has the capability to capture everyone’s eye and tell them a story with engaging content and images.  It’s an all in one package with text, images and creative design that come all along. It holds a great marketing potential that has the ability to attract customers. Many people click on infographics as it is more appealing and hence your web traffic is increased which is beneficial aspect for SEO.

Here we have the collection of 10 interesting infographics about social media. Let’s have a look at them below.
Jeff Domansky's insight:

Great collection and useful reading for marketers, and social media pros.

Jeff Domansky's curator insight, December 8, 2014 12:44 AM

Great collection of social media infographics. Well worth reading. 9/ 10

rodrick rajive lal's curator insight, December 9, 2014 1:53 AM

These are some interesting infographics that provide a pictorial representation of data in a form that can be easily understood. In an age where the quantum of data is increasing exponentially, it has become extremely important to use infographics. Raw data and statistics can become a turn off, especially for those who don't have an eye for figures! Infographics are being used very successfully in schools and colleges to present information in an easily assimilable form.

Scooped by Jeff Domansky
Scoop.it!

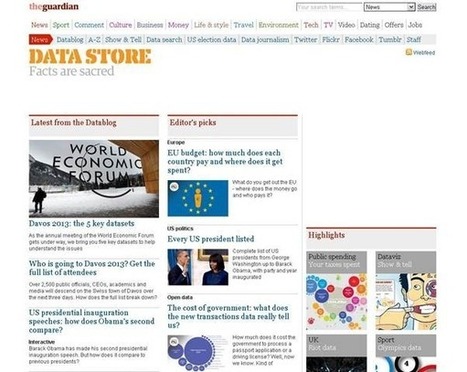
Tips, tricks and tools for data visualisation: 15 great tools for the job

Tips, tricks and tools for data visualisation: 15 great tools for the job | Public Relations & Social Marketing Insight | Scoop.it

In my previous article I discussed the importance of ensuring that your data is clean and processed before attempting any form of data visualisation. Here I will share some really awesome tools that (once your data is clean and ready to use) you can have at your disposal to create mind-blowing representations of the facts and figures. Here is a list of tools, some more open and adjustable than others, that add value to your raw data and can be used as a source of inspiration and design when approaching the visualisation process....

Jeff Domansky's insight:

Several really useful tools to help you tell a story, communicate or share complex information using data visualization.

Jenifer Rettler's curator insight, July 25, 2013 7:26 PM

We are in the year of "Big Data".   Well if data is big, so is data visualization.  Learn about some great tools to help you visualize your data. 

Anna Parisi's curator insight, August 2, 2013 4:13 PM

This is the future of process optimization 

Scooped by Jeff Domansky
Scoop.it!

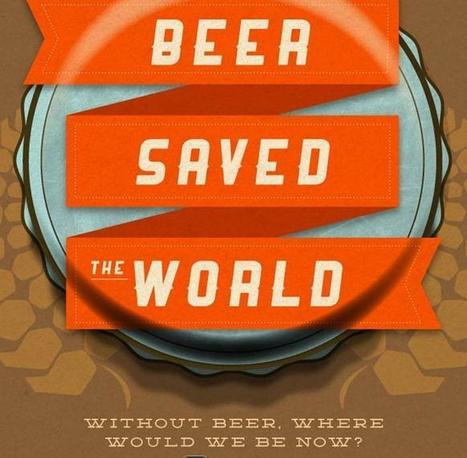
10 Beer Infographics that are Awesome | Neo Mamm

10 Beer Infographics that are Awesome | Neo Mamm | Public Relations & Social Marketing Insight | Scoop.it

From the history of beer to what to do with an empty, these infographics will provide you with a whole variety of knowledge about one of man’s most loved drinks: beer.

Jeff Domansky's insight:

Where would we be without beer? You'll learn some amazing facts about beer in these 10 infographics. Here's just a taste ;-)

-  Egyptian children were sometimes baptized with beer

-  in the 1600s, midwives created ultra-strong beer to ease the pain of childbirth

-  in 1773, the Sons of liberty gathered at the Green Dragon Tavern, had a few beers, and agreed to start a revolution

-  annual beer consumption in the US is 22 gallons per person

-  in the US today there are 1,482 craft breweries operating

-  9,000 BC Neolithic humans evolved from hunter gatherers to farmers. Was it the bread or the beer?

-  2,400 BC Sumerians invent the straw to avoid sediments in the bottom of beer

-  Plato said: "He was a wise man who invented beer."

-  takes 18 minutes to burn off the calories from a regular beer compared to 15 minutes for a pint of Guinness. Go figure.


I could go on but that would just make me thirsty for more. Just enjoy these 10 awesome infographics. Cheers!

No comment yet.