
|
Rescooped by Yashy Tohsaku from iGeneration - 21st Century Education (Pedagogy & Digital Innovation) |


Sign up to comment
Get Started for FREE
Sign up with Facebook Sign up with X
I don't have a Facebook or a X account


 Your new post is loading...
 Your new post is loading...
Your new post is loading...
Sign up to comment
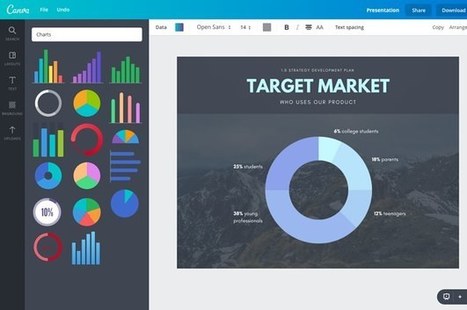
Canva, which helps you make cute social graphics, is hoping you'll ditch Microsoft Office for their ne Via Luísa Lima
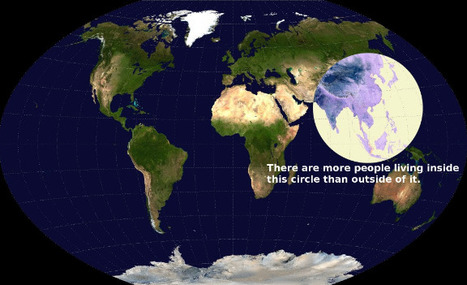
These 22 charts and maps all told me something I found surprising. Some of them genuinely changed the way I think about the world. Via Beth Dichter

Gary Harwell's curator insight,
October 5, 2014 2:06 AM
Some cool stuff to share with your students. 
Leah Hood's curator insight,
August 22, 2017 4:54 PM
If you are looking for some maps that will have students scratch their heads and consider come concepts in a new light this post will provide you with 22 choices. The one above intrigued me. It shows a map of the world, and has a circle that shows where more people live than the rest of the world. I suspect this image would bring up many questions, and that many would be interdisciplinary. Click through to the post to find many other great maps and charts.

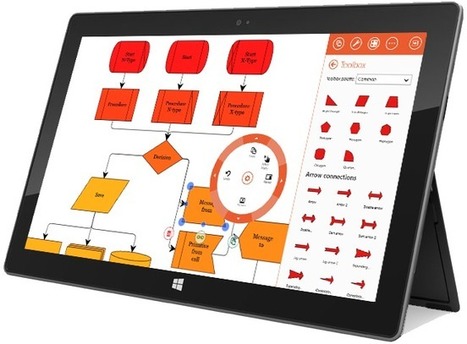
Lucidchart is your solution for visual communication. Flow charts, diagrams, UML sketches, and ER models have never been easier. Start a free trial today! Via Luísa Lima
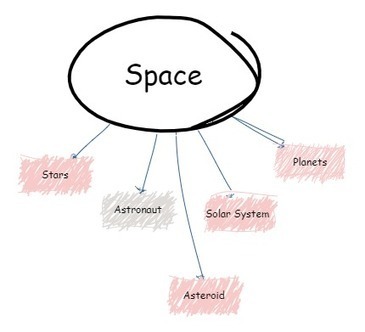
Grapholite is an easy-to-use and still comprehensive online solution to design professional-looking flowcharts, organizational charts, mind maps, Venn charts, database structures, web-site structures, etc. that can be used online and offline, in and out of browser; created diagrams can be stored locally and on the server. Via Baiba Svenca

Baiba Svenca's curator insight,
December 11, 2012 11:29 AM
To test the tool, you can use demo mode. The tool produces beautiful and detailed mind maps and diagrams. 
Janek Wagner's comment,
December 12, 2012 3:28 AM
LOL: This application requires you to update your browser with the Microsoft Silverlight plug-in.
|
Canva, which helps you make cute social graphics, is hoping you'll ditch Microsoft Office for their ne Via Luísa Lima

"Through the Free Technology for Teachers Facebook page I recently received a request for some suggested online chart creation tools..." Via Baiba Svenca

Gust MEES's curator insight,
February 11, 2015 11:13 AM
Lucidchart is an easy tool to use to create flowcharts, mindmaps, and graphic organizers. Lucidchart offers a simple drag and drop interface for creating flow charts, organizational charts, mind maps, and other types of diagrams. To create with Lucidchart just select elements from the menus and drag them to the canvas. You can re-size any element and type text within elements on your chart. Arrows and connecting lines can be re-sized, repositioned, and labeled to bring clarity to your diagrams. Find out more tools by visiting the article...

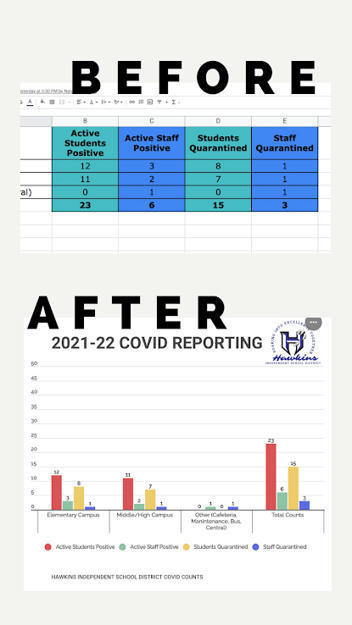
Charts are a great tool because they communicate information visually. On Onlinecharttool.com you can design and share your own charts online and for free. We support a number of different chart types like: bar charts, pie charts, line charts, bubble charts and radar plots. Via Baiba Svenca
Baiba Svenca's curator insight,
March 6, 2013 1:26 PM
Chart Tool is the easiest and fastest web application for creating different charts to be used in your presentations. No registration is required. Build your chart and download it in various formats or send it to anyone by email. Chart tool is free to use. 
Tom Perran's curator insight,
March 6, 2013 8:47 PM
Nice to have all of these different charts in one place. |